Setup time: 5 Min
1. Create Prometheus Integration on All Quiet
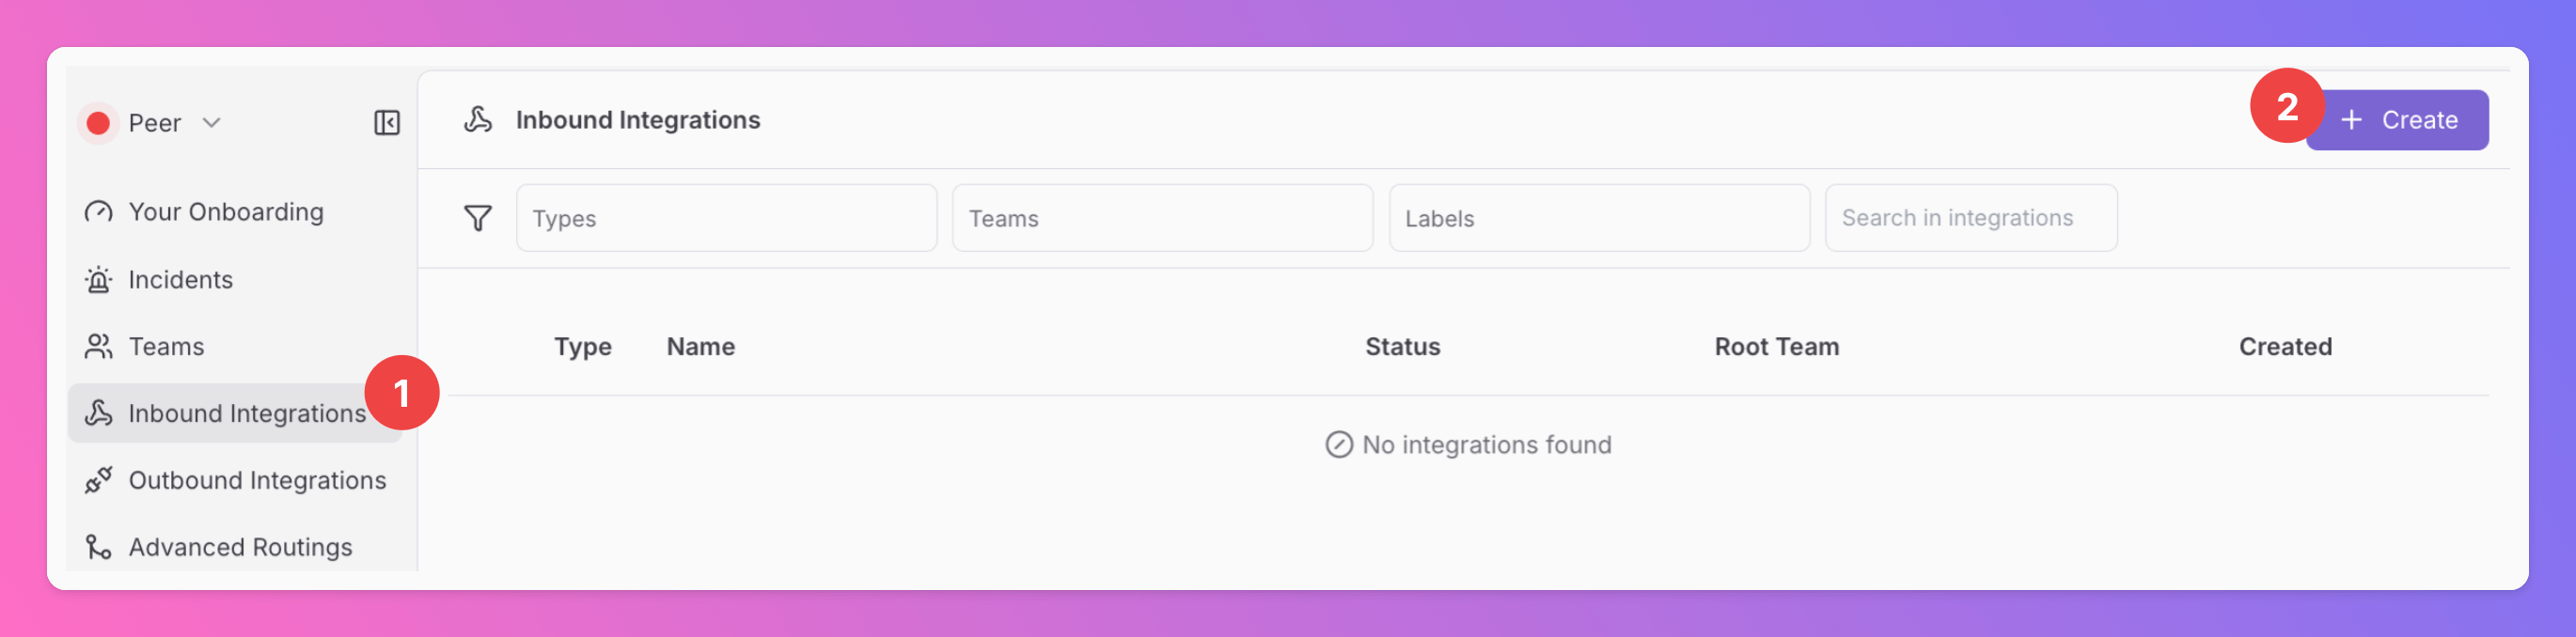
Login into your All Quiet account.Create Integration
- Click on the
Inbound Integrationstab. - Click on
+ Create.
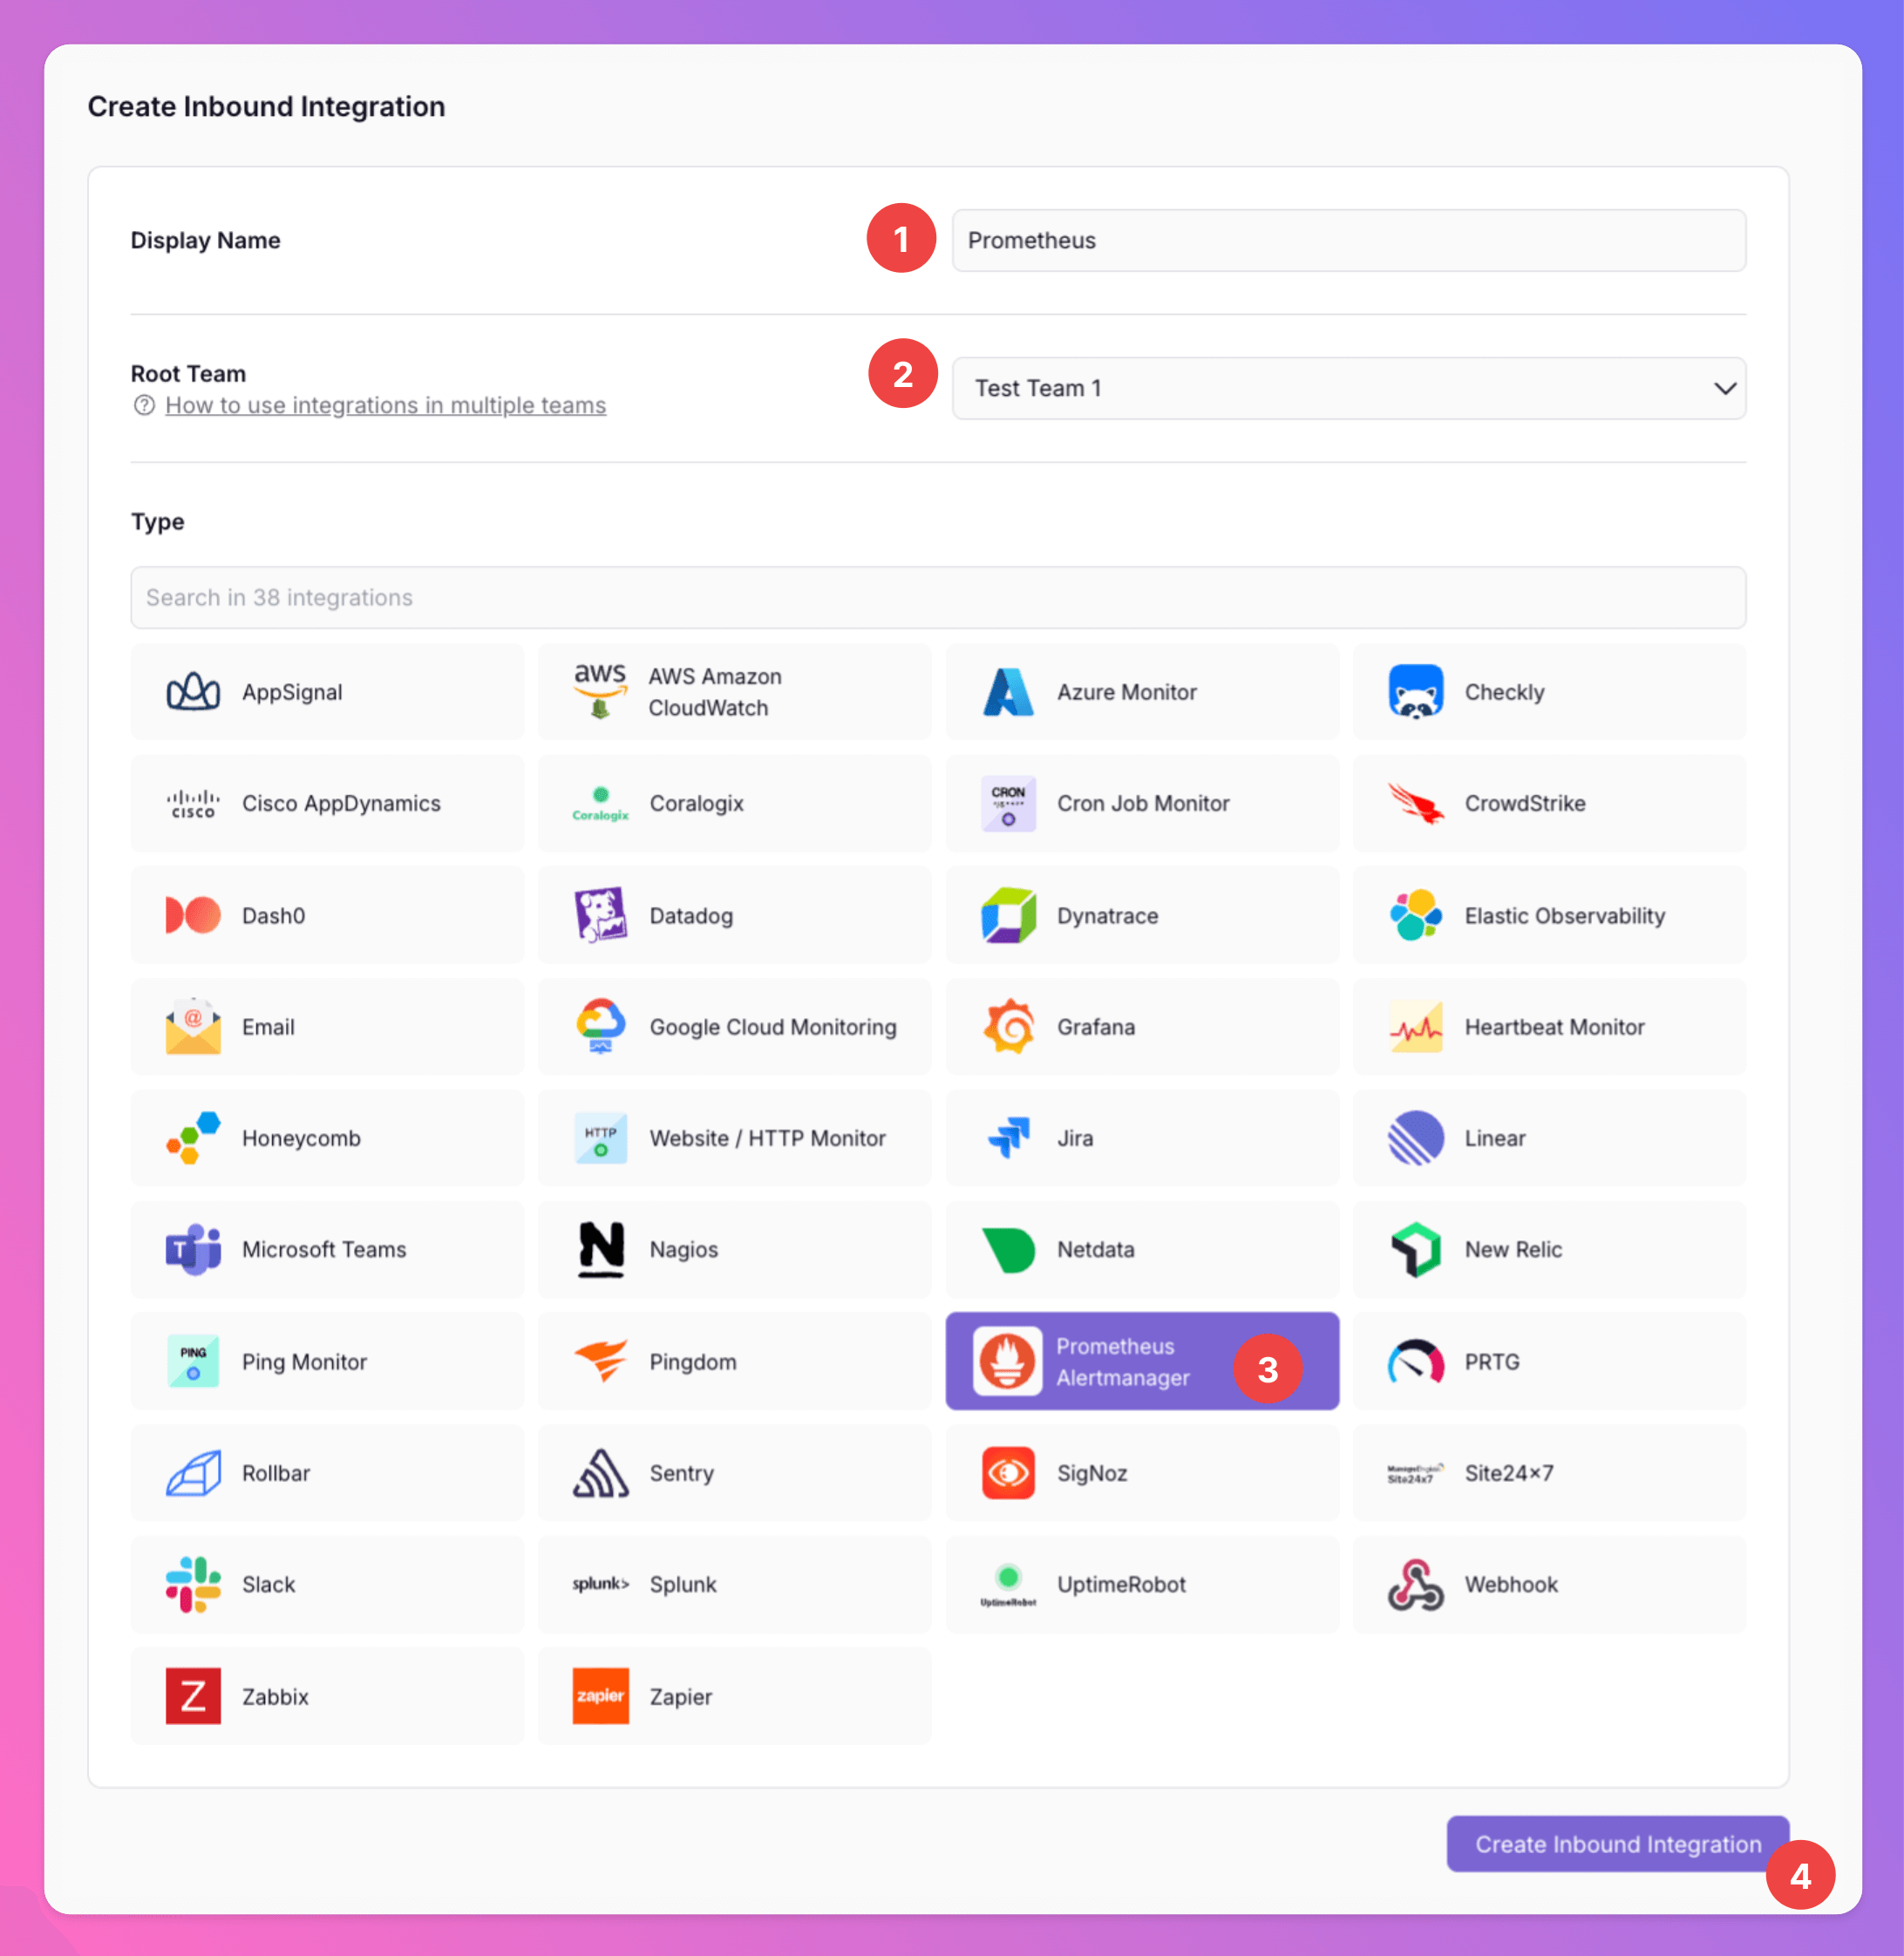
Select Prometheus for the integration’s type
- Enter a
Display Namefor your integration, e.g. “Prometheus”. - Select a
Team. - Select
Prometheus Alertmanageras the integration’s type. - Click
Create Inbound Integration.
Copy Webhook URL
After successfully creating your Prometheus Alertmanager integration, make sure to copy the webhook URL.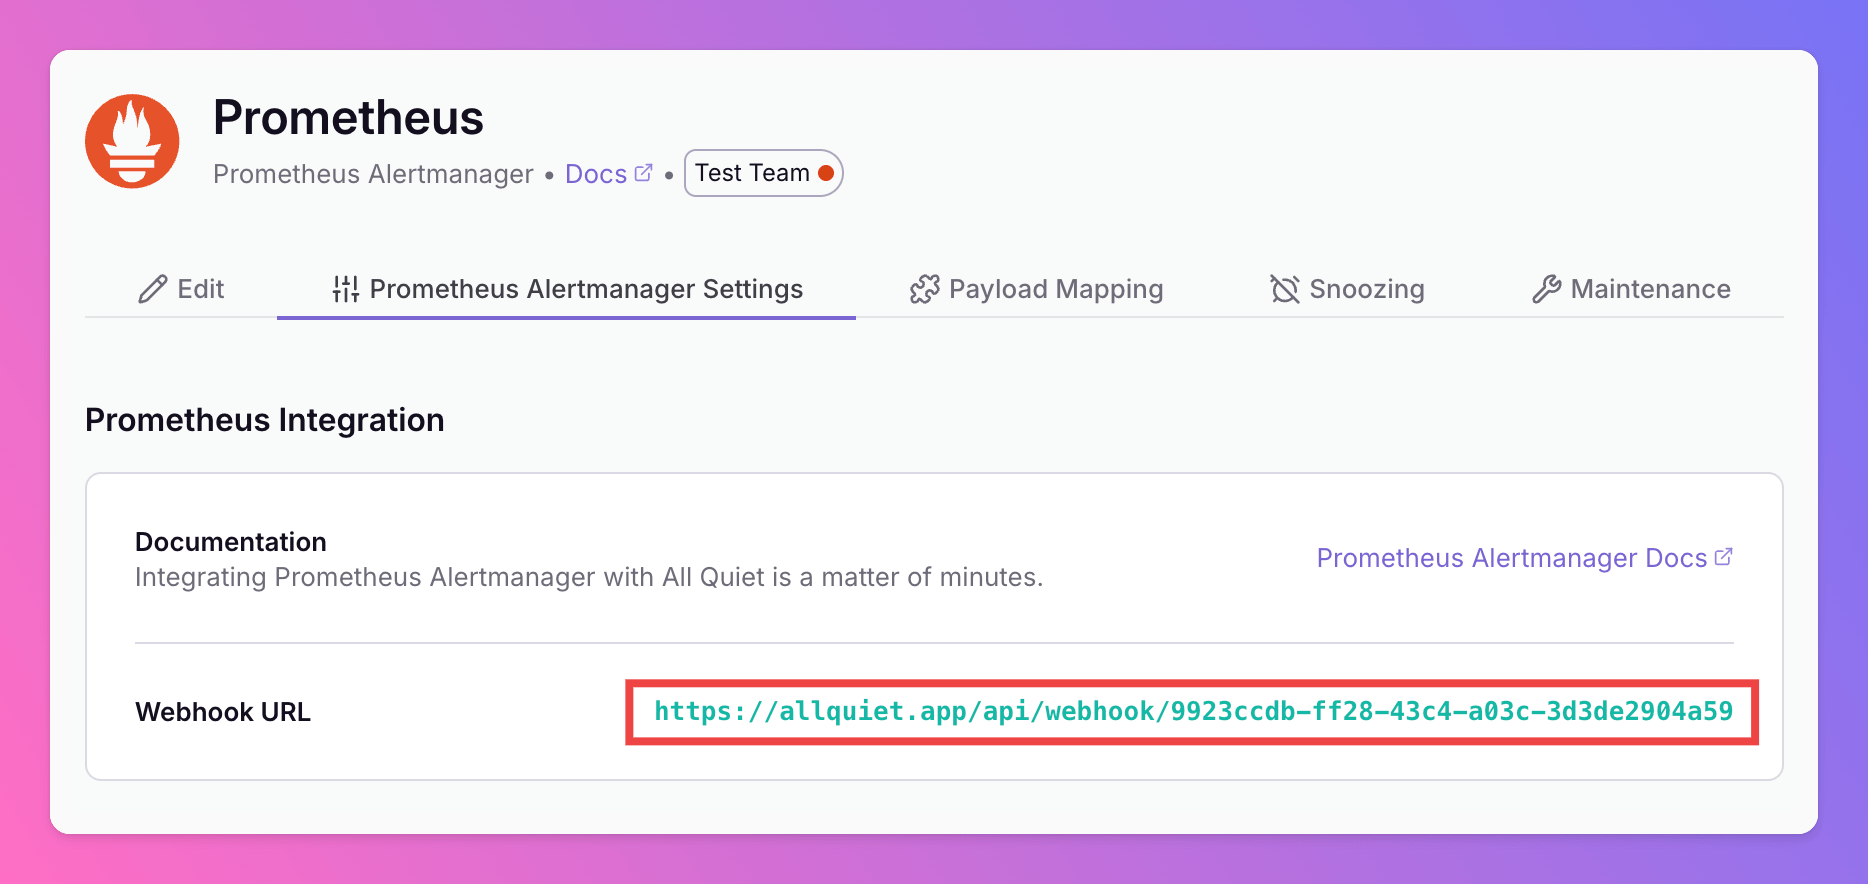
Optionally toggle
Enable additional Authentication & Security below the webhook URL to restrict who can POST payloads.- IP Filter — Allow requests only from specific IPs or CIDR ranges. Failed checks return 404 Not Found.
- Bearer authentication — Require
Authorization: Bearer YOUR_TOKEN. Missing or invalid tokens return 401 Unauthorized.
2. Configure Prometheus Alertmanager
Once you’ve set up an integration of type “Prometheus Alertmanager” with All Quiet, the next crucial steps involve configuring your Prometheus and Alertmanager instances. This is essential for ensuring that your monitoring setup can effectively send incidents to the All Quiet webhook. In this part of the guide, we will walk you through simple yet effective configuration examples for both Prometheus and Alertmanager.Setting Up Prometheus
First, let’s start with the Prometheus configuration. Your prometheus.yml should include the necessary scrape configs to monitor your targets. Here’s an example of a basic configuration: In your prometheus.yml, the configuration should primarily include scrape_configs and alerting details. Below is an example configuration:scrape_configs defines the job for scraping metrics from allquiet.app, with a frequent interval of every 5 seconds. We’re observing our own platform in this example :). The https scheme and/status metrics path dictate how Prometheus accesses the data.
The rule_files section tells Prometheus to load any alerting rules from files ending with .rules.
The alerting section is crucial for the integration. It specifies that Prometheus should send alerts to an Alertmanager instance located at your-prometheus-alertmanager.yourdomain.com:9093.
With these settings, Prometheus is configured to monitor allquiet.app closely and forward alerts to Alertmanager, which then communicates with the All Quiet platform, ensuring efficient incident management.
Setting Up Alert Rules
After configuring theprometheus.yml file, the next step in integrating Prometheus with All Quiet is to set up alert rules. Alert rules in Prometheus define the conditions under which an alert should be fired. Below is a sample alert rule file that demonstrates how to create a rule for monitoring response times.
Here’s the alert rule configuration:
allquiet.app. The rule Response Time slowtriggers an alert if the scrape_duration_seconds for the allquiet.app job exceeds 0.1 seconds, sustained over a period of 5 seconds. This means if the response time of the monitored service goes beyond 100 milliseconds and stays that way for at least 5 seconds, an alert is triggered.
The labels section classifies the alert’s severity as critical, which can be useful for advanced routing and handling the alert. The annotations section provides a descriptive message for the alert, e.g. indicating that the response time of the service is poor. :)
By implementing this alert rule, you can effectively monitor critical performance metrics like response times and ensure that such issues are promptly flagged and communicated to the All Quiet platform for efficient incident management.
Setting Up Alertmanager
The final step in integrating Prometheus Alertmanager with All Quiet is to configure the Alertmanager itself. This configuration ensures that Alertmanager appropriately routes, groups, and sends alerts to the All Quiet platform. Here’s how to set up the Alertmanager using the provided YAML configuration: In this configuration:- The
routesection defines how alerts are processed and sent to receivers.group_waitsets the time to wait before sending a notification about new alerts that are added to a group of alerts.group_intervalsets the interval between sending notifications about the same group of alerts, whilerepeat_intervalcontrols how long to wait before sending repeat notifications. We recommend to avoid grouping alerts as we will only create one and not several incidents based on one payload / Prometheus alert. You can achieve this by using thegroup_bycondition as in the example above. - The
receiverparameter within therouteis set to'allquiet'. This tells Alertmanager to use theallquietreceiver for notifications. - In the
receiverssection, a receiver namedallquietis defined. This receiver useswebhook_configsto send alerts to the specified URL, which is the webhook provided by All Quiet in Copy Webhook URL.
3. Test Your Integration
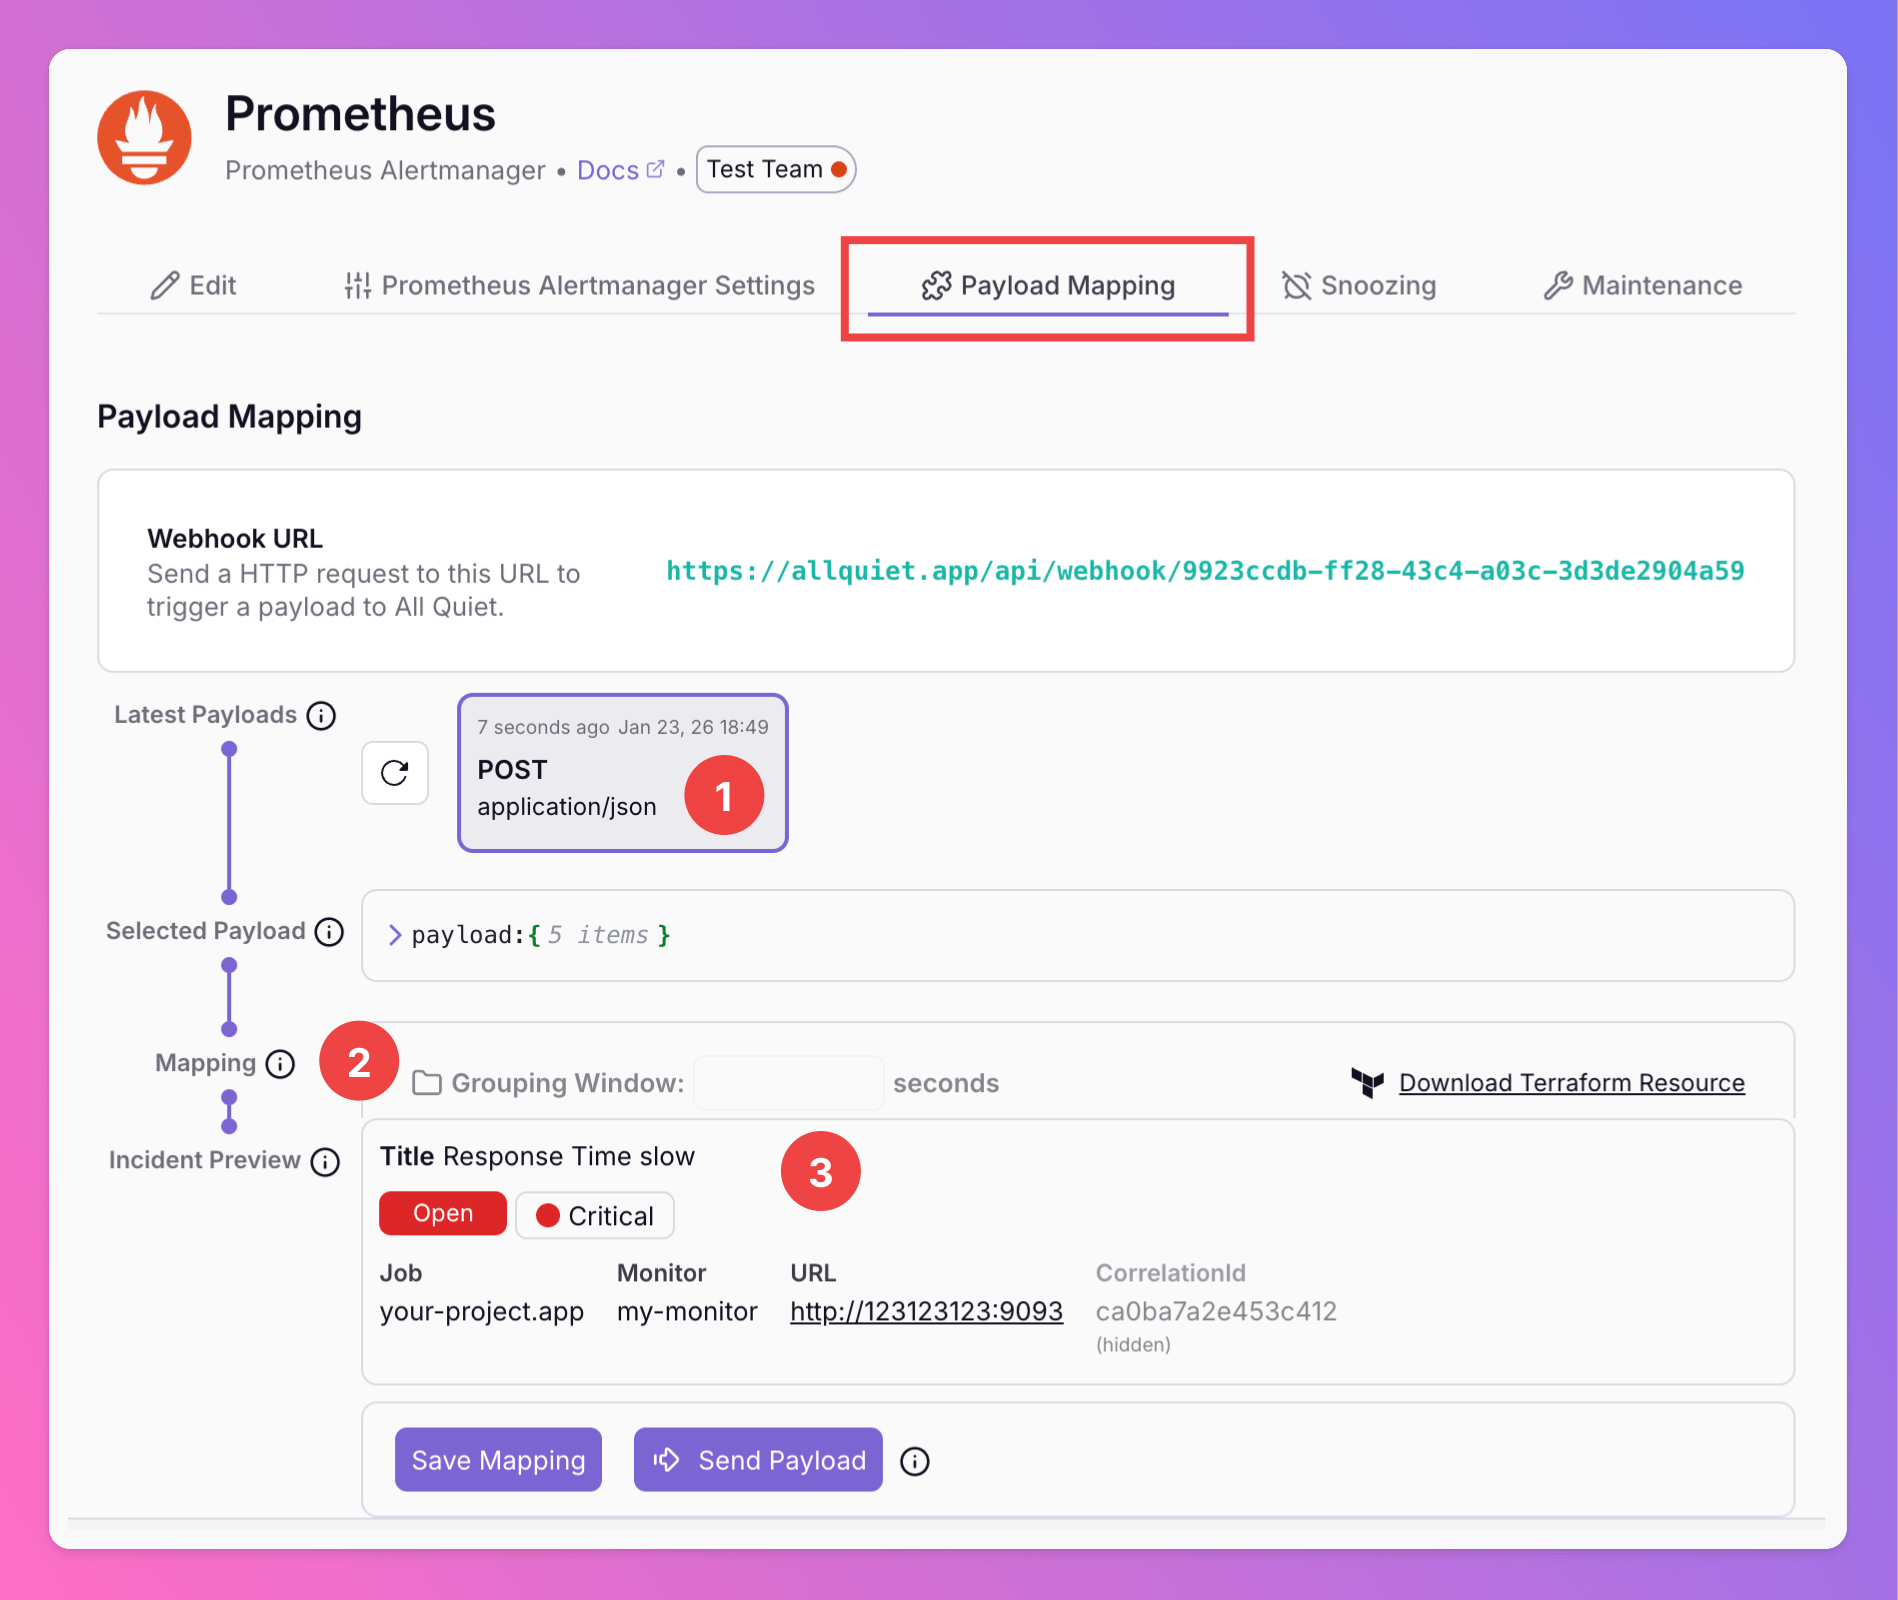
You’re almost done. 🥳 The next steps are merely there to verify if everything’s setup correctly! Navigate back to All Quiet and open thePayload Mapping tab of the integration that you’ve just created.
- Find the test payload in the
latest payloads. - Our pre-configured
payload mappingwill transform Prometheus alerts into All Quiet incidents. You can adjust the mapping to your liking anytime. - Observe how the mapping transforms the selected Prometheus Alertmanager payload into an All Quiet incident.
Prometheus Alertmanager is now successfully integrated with All Quiet, following the detailed setup and verification steps provided.